Production Possibility Curve
PPC is very important topic to be discussed. The production possibility curve helps to understand how much can be produced in an economy. The production possibility curve can be defined as a curve that shows the maximum goods and services that can be produced in an economy. The curve talks about this in a limited time period. But since resources are scarce in nature, a choice has to be made between the alternative goods that can be produced.
In this article, we will be discussing the production possibility curve. The production possibility curve helps understand how much can be produced in an economy. The production possibility curve is an important part of further topics in Economics. A basic understanding of the production possibility is extremely helpful in further understanding. This is a topic that is discussed in many different topics of Economics.
Let us start with a discussion of Production Possibility Curve.
When a firm decides to produce something, it must look at how much factors of production it has. To produce a number of goods, the firm will need a certain quantity of factors of production. It will need a certain size of land. It will need the required number of labor. Capital will be needed as money for the investment. Intellectual capital will be needed to produce the best quality of goods. The number of factors that are available, will decide how much the firm can produce.
Let’s take a simple example here. In a firm, one worker can produce a maximum of thirty goods, even with overtime. The firm only has forty workers as labor and cannot hire more. The forty workers can produce a maximum of 1200 goods in a day. If the firm wants to produce more than 1200 goods in a day, it cannot do so. The number of labor that the firm has, does not allow the firm to be producing more than a total of 1200 goods.
This brings us to the production possibility curve. The production possibility curve can be defined as a curve that shows the maximum goods and services that can be produced in an economy. The curve talks about this in a limited time period. Talking in terms of macroeconomics, the PPC (production possibility curve) shows us the goods and services that can be provided with the all the resources in the economy. It is assumed that all resources are being used efficiently and to the full extent.
Below is the diagram of the production possibility curve:
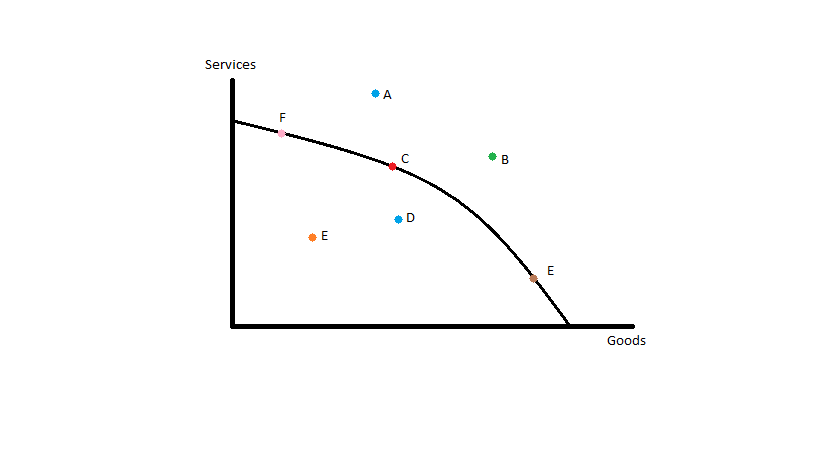 Let’s analyze the curve. The curve is the production possibility curve. Looking at each point individually, let’s start with point E. This happens to be between the axes and the curve. The PPC tells us the maximum and efficient quantity of production. At point E, production is not at its highest level. It is inefficient. The production can easily be increased by using more factors of production.
The same is the case for point D. It also exists between the axes and the curve. This again means that production is not at its highest level and it can easily be increased. This can be done simply by using the available unused factors of production.
Now, let’s look at point A. This point is outside the limits of the production possibility curve. This means that the economy is able to produce more than the available resources allow. This is only possible in one case. It can only be done by making labor work overtime. This cannot happen for too long. Labor will not work overtime for a period, of say, one year. The point is not possible in a bigger time period as factors of production do not allow it do so. This point is not possible under normal circumstances.
The same is the case for point B. It is also only possible by making labor work overtime which will not be possible for a bigger time period. Point B is also not possible under normal circumstances.
Look at point C now. This point happens to be located on the production possibility curve itself. What does this mean? This means that at this point, the economy of the country is producing one possible maximum combination of goods and services in such a way that all available resources are being used in the best way possible. It is good for the economy to be at this point as no resources is being wasted.
Similarly, both point E and point F operate on the Production possibility curve. This tells us exactly what point C tells us. The economy is not wasting any resources and these resources are being used efficiently, in the best way possible.
But it is important to understand that there is a difference between Point C, Point E, and Point F. Even though, they all exist on the PPC, not all are the best for the economy. At point C, it can be seen that the economy is producing a balance amount of goods and services. When we move from point C to point F, the economy starts producing more services. If there were unused resources in the economy, this would be fine. But since all are being used, production of goods must be given up to give more services. At point F, there are high number of services, and less number of goods.
Similarly at E, the economy is producing more goods and less services. At both point E and Point F, there is an imbalance between goods and services. For an economy to be successful, it is important for there to be a balance. If too much of either good or services is produced, it can be bad for the economy. So it is better, not necessarily best, for the economy to choose point C.
This completes our discussion of the production possibility curve. You can also understand this in an entertaining manner with this video.